

Performance in the multifamily market ended 2018 much stronger than anticipated and has remained healthy through the first half of 2019. Strong economic growth and the robust labor market continue to support the strength in the multifamily market.
2019: Mixed Start to the Year
The multifamily market saw a strong end to 2018 with near-record absorptions and stronger rent growth compared with the prior few years. The first half of 2019 has seen mixed results, with slower growth in the first quarter but preliminary second quarter information indicating the spring leasing season is off to a strong start. Going forward, the labor market is expected to continue to drive demand for housing, benefiting both single family and multifamily. Pending any broader economic event that would impact the labor market, there is no real estate specific headwind on the horizon that could disrupt the favorable outlook for multifamily through the rest of this year and into the next.
The strong end to 2018 and relatively weaker start to 2019 can be partially attributed to the recent volatility in interest rates. The third and fourth quarters of 2018 saw some of the strongest absorption gains in the multifamily market during the current post-recession cycle. Seen in Exhibit 1, RealPage reports the second half of 2018 saw average annual absorptions at 350,000 units. This can be partially attributed to interest rates climbing up as high as 3.2% in November 2018 – the highest since May 2011. Coupled with strong home price appreciation in the beginning of 2018, this enticed some potential homebuyers into rentals. The homeownership rate reflects this volatile environment, albeit delayed slightly, tumbling for the first time in two years in the first quarter of 2019, down 60 bps to 64.2%.
The first quarter of 2019 saw that trend slow down as absorptions waned and high levels of new supply entered the market, causing occupancy to retract and rent growth to moderate. While this slowdown is not abnormal due to seasonality, at the same time the decline in interest rates, down to 2.1% as of June, could have enticed more households to ownership limiting rental demand. Preliminary second quarter information indicates a resurgence in absorptions, despite rates remaining low. While the strong start of the spring leasing season is a good sign that demand remains robust even in a low interest rate environment, a sign that potential homebuyers may be more willing to make the leap into ownership given lower interest rates.
Exhibit 1: Annual Multifamily Absorptions
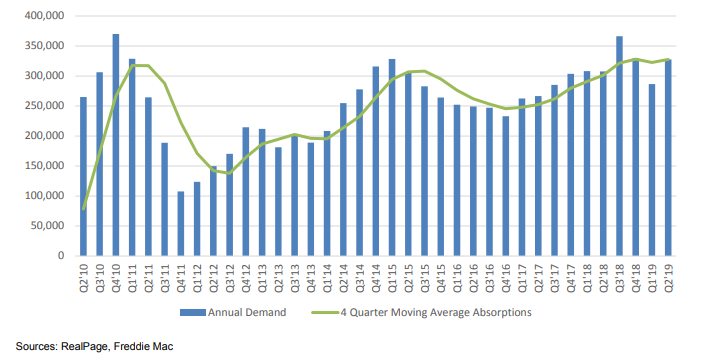
As the 2019 leasing season picks up, the multifamily market remains in a good position to absorb most of the new supply. Vacancy rates continue to beat out most projections while rent growth remains above the rate of inflation. Despite the slower start to the year, RealPage reported a strong second quarter with annualized absorptions up to 327,000. Occupancy climbed to 95.9%, up 50 bps over the year, while same-store rents grew 3.1% annually.
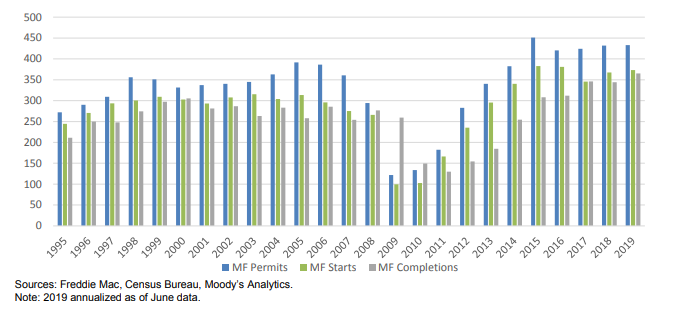
Despite multifamily construction churning at elevated levels, we continue to see an overall shortage in housing as household demand outpaces total supply. The U.S. Census Bureau reports five-plus unit multifamily completions are on pace in 2019 to exceed the previous few years; as of June up to 365,000 units annualized, compared with 345,000 units seen in each of the prior two years, shown in Exhibit 2. Meanwhile, total housing completions over the past three years have averaged 1.1 million housing units each year. During that same time, total households have increased on average 1.4 million each year. The continued increase in multifamily construction when the overall housing market continues to remain unbalanced is not necessarily an oversupply concern as the economy struggles to build enough housing.
The strength of the labor market will continue to support the housing market, in both single family and multifamily. As of June, the economy added an estimated 1 million jobs so far in 2019 with unemployment rates remaining low at 3.7%. Wage growth has been relatively consistent, between 2.7% and 2.9% over the past six quarters, according to the Employment Cost Index, but has not yet returned to the pre-recession growth of 3% to 4%. The persistent low unemployment rate has created some pick up in wage growth; however, given the low interest rate and inflation environment, wage growth may remain lower compared with previous economic expansions.
Exhibit 2: Multifamily Permits, Starts and Completions (5+ Units, thousands)
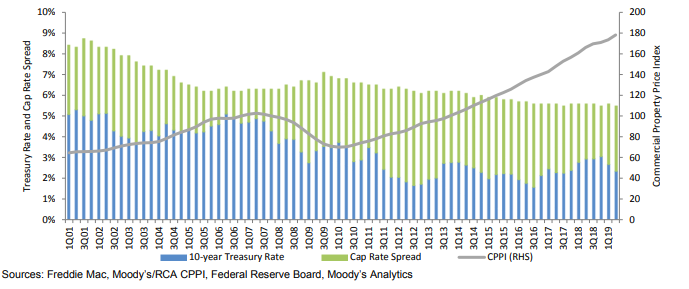
The increase in the 10-year Treasury rate through the end of 2018 compressed cap rate spreads to their lowest level since 2007 at 250 bps. The compression comes as cap rates have not budged during Treasury rate swings and have continued their downward trend over the past several years. As of the second quarter, with interest rates declining, the cap rate spread has widened out 70 bps to 320 bps. While historically cap rates remain correlated with interest rates, cap rates have seen little impact from the volatile interest rate environment.
As a result of consistently lower cap rates, we see apartment price appreciation moderate in the recent few quarters. As of the second quarter, prices grew a healthy 7.3% over the past year – the lowest annualized growth since 2010. Value growth is generally expected to come more from income growth going forward instead of cap rate compression. We expect annual growth rates of 10-12% may be behind us now, as we expect price appreciation to be more modest going forward, but continued Treasury rate declines will support continued growth.
Exhibit 3: Multifamily Price Index, Cap Rate Spread and Treasury Rate
2019 and Beyond: Healthy Growth Continues
The multifamily market is expected to remain healthy for the rest of 2019 and into 2020. While moderation is expected at this stage in the cycle, the current trajectory of the economy does not indicate any looming headwinds that would cause major disruption to the multifamily market. If interest rates remain low, we could see more households open their doors to ownership, but we do not anticipate this to cause a substantial slowdown in the multifamily market due to the overall shortage of housing. However, trade tension and economic uncertainty continue to lurk in the minds of most economists. While there is no indication of an imminent economic slowdown, a dramatic impact to the labor market would impact overall demand for apartment units, especially at the higher end of the rent spectrum.
Nonetheless, the expectations are for demand to remain robust and continue to entice construction of multifamily units. New supply is scheduled to remain elevated for the next few years. So far this year, we have seen completions higher than the previous few years. RealPage, which reports on the larger, institutionalized buildings, forecasts annual completions of apartment units to increase throughout the rest of 2019 and 2020, reaching 340,000 annually on average, above the 300,000 seen on average going back to 2016.
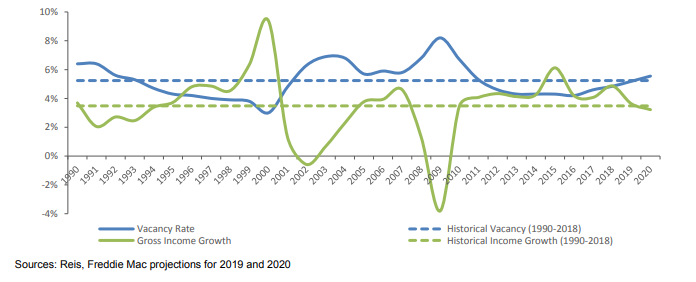
As more supply enters the market, we expect vacancy rates to increase throughout the year, but only marginally, up to 5.2%. Expectations are for this high level of demand seen in the past few quarters to cool a bit going forward, and as a result we could see vacancy rates move above the long-run average by 2020; however, for the past few years we have seen absorptions consistently outperform expectations. Typical demand drivers in our models cannot pick up the acute changes in lifestyle and demographic preferences. We expect those fundamentals to hold and would expect vacancy rates to remain below the historical average over the next two years.
Rent growth will remain healthy but at more modest levels compared with the robust growth seen in 2018. We expect rent growth of around 4% in 2019 and 3.6% in 2020. The increasing vacancy rate would cause income growth to moderate as landlords choose stable occupancy over pricing gains. At the current vacancy rate projection, gross income growth is forecasted to drop slightly below the long-run average by 2020. While lower, this growth level still portrays a healthy market and growth above the target inflation rate of 2%. Likewise, if vacancy rates remain below the historical average, we could see rent and income growth come in stronger in 2020.
Exhibit 4: Vacancy Rate and Gross Income Growth, History and Forecast
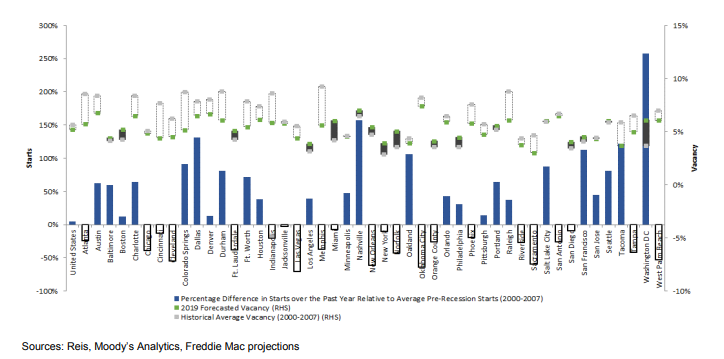
At the metro level, we see similar dynamics from the prior few years: Construction remains elevated but with the majority of metros expected to see vacancy rates remain below the long-run average. There is little change in the leader board for the metros with the highest level of construction starts compared with historical averages; Washington, D.C., representing only the District of Columbia, remains the highest followed by Nashville and Dallas. In the past few months, Houston, Orlando and Baltimore have seen the largest increases in construction starts compared with their historical norm. On the flip side, Portland, Oakland and San Diego have seen the largest decreases in construction starts.
High supply is not necessarily a bad sign if there is enough demand to meet it. In Exhibit 5 we use the historical vacancy rate compared with the forecasted rate as a proxy for how well the metros could absorb the new supply. We forecast that 65% of metros are expected to see vacancy rates remain below historical averages, indicating they are in a good position to absorb most of the new supply. As supply is delivered, we expect several more metros to see vacancy rates above their historical averages throughout the year, mostly in areas that have taken on a lot of new supply recently, such as Portland and Nashville. At the same time, we could see vacancy rates contract in places like New York City as supply slows and absorptions catch up.
Exhibit 5: Multifamily Starts and 2019 Forecasted Vacancies Relative to History
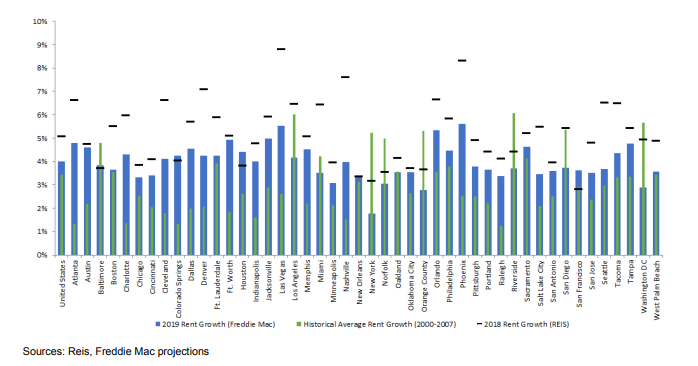
From Exhibit 6, we see some movement in rent growth with most metros experiencing moderation from 2018 levels. The expected growth in 2019 did not significantly shift from earlier in the year; instead, the moderation magnitude changed as 2018 ended the year stronger than anticipated. Most metros will continue to see growth above their historical averages through 2019, as well as above the target rate of inflation of 2%, except in New York City – which continues to work on absorbing the high levels of new supply.
Exhibit 6: Rent Growth in 2019 and 2018 Relative to History
We continue to see the strongest growth in sunbelt metros that were late to recover from the Great Recession. In 2019, we forecast Las Vegas to have the highest gross income growth followed by Orlando and Phoenix. Florida continues to perform well with Tampa and Fort Lauderdale rounding out the top five. This strength is attributed to the strong population growth and relatively low rate of new supply and low vacancy rates in those respective markets. Overall, we see the magnitude of growth on the list of Top 10 metros lower than in the previous few years.
Exhibit 7: Top 10 Metros by Gross Income Growth for 2019
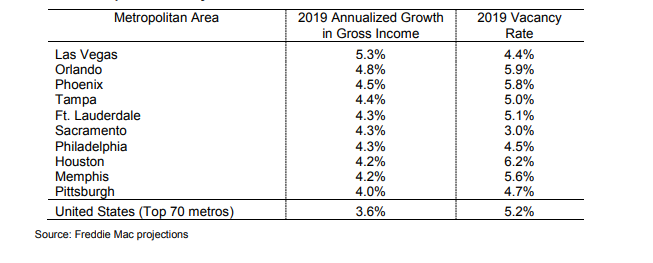
Las Vegas, Orlando and Phoenix are expected to see strong employment growth of around 3% in 2019 coupled with above 2% population growth. Supply remains relatively low in most of these areas, especially Las Vegas which has not caught up with pre-recession construction norms. The lack of new supply has kept vacancy rates below the historical average allowing rents to increase faster than average.
Sacramento continues to see strong demand and limited new supply, but otherwise is the only West Coast market to make the list. As new supply has caught up in places such as Portland and Seattle, rent growth has slowed as supply outpaces absorptions.
We see some interesting metros make the list for 2019, including Philadelphia, Memphis and Pittsburgh. While these metros are expected to see strong growth this year, it is not expected to be long-lived. Instead, as reported by RealPage, they are experiencing inconsistent, brief periods of solid performance. These metros typically have slower-growth economies that do not support a robust multifamily market. New completions are met with demand due to the limited amount of new supply, but projects are few and far between. As such, recent improvement can be attributed to performance in the top end of the market.
In Houston, we see a mixed story between current and forecasted conditions. So far this year, Houston has posted weaker performance due to those who sought temporary residency in apartments after Hurricane Harvey before moving back to their permanent homes. However, the economics remain favorable with strong employment, income and population growth expected, as well as relatively low vacancy rates. At the same time, construction has returned to the multifamily segment but remains well below the historical average. We anticipate the favorable economics to create strong demand for Houston through the rest of the year, but the question is if the loss of residences back to single family outweighs the strength of the economy to keep up demand for apartment units.
Origination Market Forecast
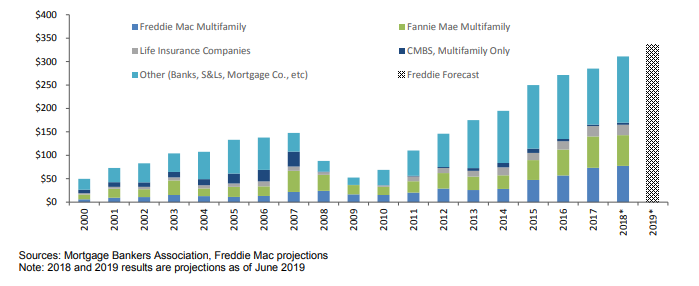
Multifamily originations are expected to set another record year in 2019 due to strong fundamentals, continued demand for multifamily investments and low interest rates. Actual volume for 2018 will not be available until the fall of 2019, but our expectations are for total origination volume in 2018 to rise by 9.1% to $311 billion. Based on forecasts as of the second quarter of 2019, if interest rates remain around 2.2% for the rest of the year, we forecast volume in 2019 to increase by 8% to $336 billion. However, lower interest rates will continue to push origination volume higher given the continued strong fundamentals and preference for multifamily investments. As of August 5th, the 10-year Treasury reached 1.75%, a decline of 150 bps from last November. Last time rates were this low was in October 2016, but a drop of this size over a similar time period last occurred in January 2012. Rate declines generally drive origination volume higher, and with a drop of this magnitude to very low levels, forecasts must be decisively higher than earlier in the year.
Exhibit 8: Multifamily New Purchase and Guarantee Volume ($ Billions)
Overall, the multifamily market continues to perform above average so far this year and is expected to follow similar growth trends for the rest of 2019. Second quarter reports indicate stronger growth compared with the beginning of the year, which could keep the market going strong through 2020. Meanwhile, the low interest rate environment will create strong demand for multifamily investments, driving up origination volume, but with moderated appreciation growth potential going forward. The shortage in overall housing relieves any fears of a nationwide oversupply concern, and as long as employment growth remains strong, we do not anticipate any immediate headwinds that could derail the multifamily market.
For more insights from the Freddie Mac Multifamily Research team, visit https://mf.freddiemac.com/research.